Envelope Detection
This demo implements two common methods of envelope detection and tests them with a sample speech signal and a modulated sine wave.
The envelope of a signal is the outline of the signal. It can be think of an envelope detector as a system that connects all of the peaks in the signal. Envelope detection has numerous applications in Signal Processing and Communications, including amplitude modulation (AM) detection.
Method 1: Squaring and Low Pass-Filtering
Method 2: The Hilbert Transform
Squaring and Low Pass-Filtering
The first method works by squaring the input signal and sending it through a low-pass filter. Squaring the signal effectively demodulates the input by using itself as the carrier wave. This means that half the energy of the signal is pushed up to higher frequencies and half is shifted towards DC. The envelope can then be extracted by keeping all the DC low-frequency energy and eliminating the high-frequency energy. In this demo, a simple minimum-phase low-pass filter is used to get rid of the high-frequency energy.
In order to maintain the correct scale, two more operations are included. The first is to place a gain of 2 on the signal. Since we are only keeping the lower half of the signal energy, this gain boosts the final energy to match its original energy. Finally, the square root of the signal is taken to reverse the scaling distortion from squaring the signal.
This method is useful because it is very easy to implement and can be done with a low-order filter, minimizing the lag of the output.
Method 2: The Hilbert Transform
The second method works by creating the analytic signal of the input by using a Hilbert transformer. An analytic signal is a complex signal, where the real part is the original signal and the imaginary part is the Hilbert transform of the original signal.
The Hilbert transform of the signal is found using a 32-point Parks-McClellan FIR filter. The Hilbert transform of the signal is then multiplied by i (the imaginary unit) and added to the original signal. The original signal is time-delayed before being added to the Hilbert transform to match the delay caused by the Hilbert transform, which is one-half the length of the Hilbert filter.
The envelope of the signal can be found by taking the absolute value of the analytic signal. In order to eliminate ringing and smooth the envelope, the result is subjected to a low-pass filter.
Envelope Detector Model
The all-platform floating-point version of the model is shown below. When we run the demo, we will see the original signal and the results of both envelope detectors.
Envelope Detector Results
This demo shows the results of the two different envelope detectors for two different types of input signals. The input choices are a sample speech signal or a 100 Hz sine wave that turns on and off.
The model has a switchable input and two outputs which are routed to scopes for easy viewing. If a signal is not visible, double-click on the Scope block to open it.
The input scope plot shows the original signal. The signal lasts a total of 5 seconds, with 1 second of data being shown at a time.
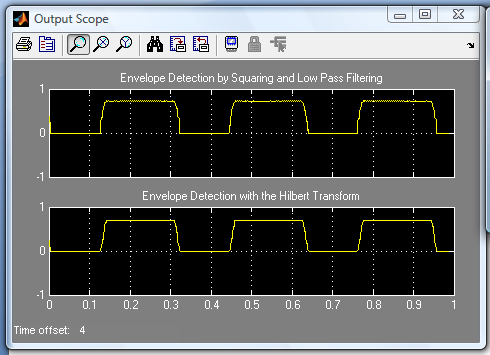
The first output scope plot shows the output of the first envelope detector. This is the result of squaring the original signal and sending it through a low-pass filter. You can clearly see that the envelope was successfully extracted from the speech signal.
The second output scope plot shows the output of the second envelope detector, which employs a Hilbert transform. Though the output of this envelope detector looks very similar to the first method.
 BooknStuff Find educational solution, notes and support for various standards


